The bar graphs and Gantt plots below were created with the software Tableau, using the same spreadsheet of standardized publication data available in Print Appendix A. That data can be downloaded as a CSV file here.
Most Popular Editions of Practical Books
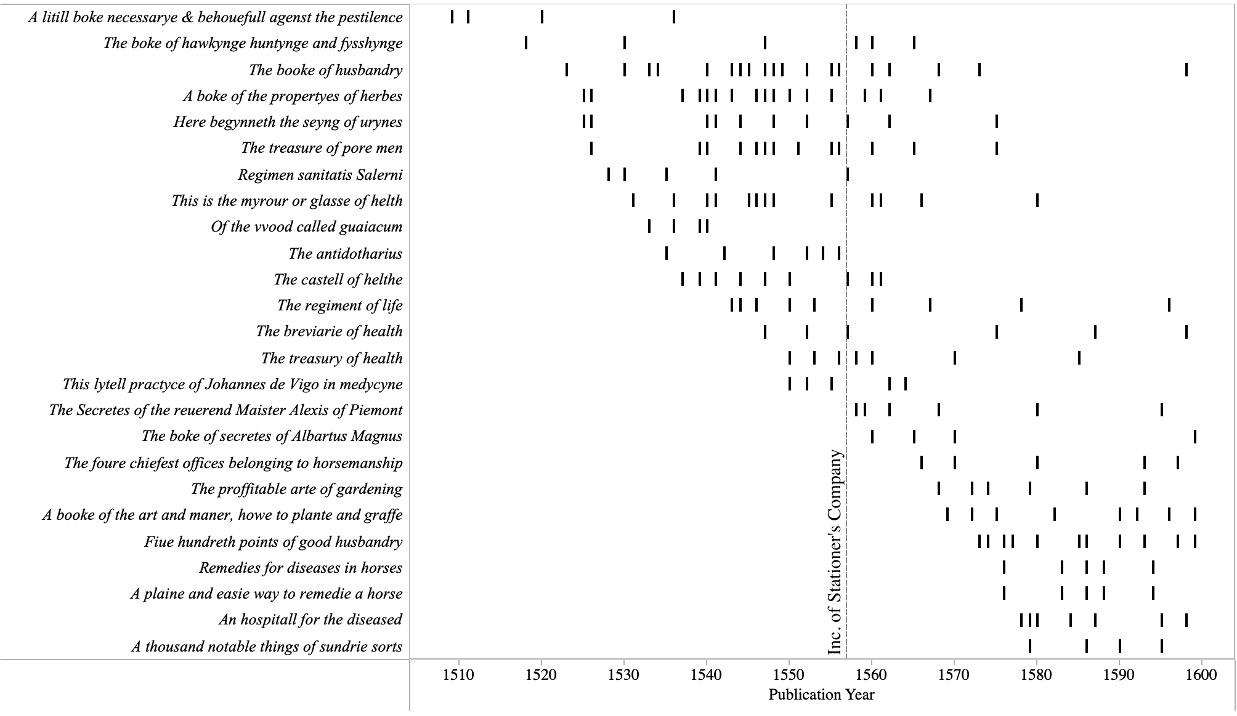
This Gantt chart shows the publication dates for the most popular practical books
published between 1500 and 1600 (defined as texts issued in 5 or more editions). The dotted line at the
center represents the incorporation of the Stationer’s Company in 1557. With publication dates plotted like this,
it is easier to see how the titles that were immensely popular (and reprinted by multiple printers)
in the 1530s and 1540s faded from the print market after the Stationer’s Register made it possible
for publisher’s to protect their rights to a title.

Practical Books by Genre
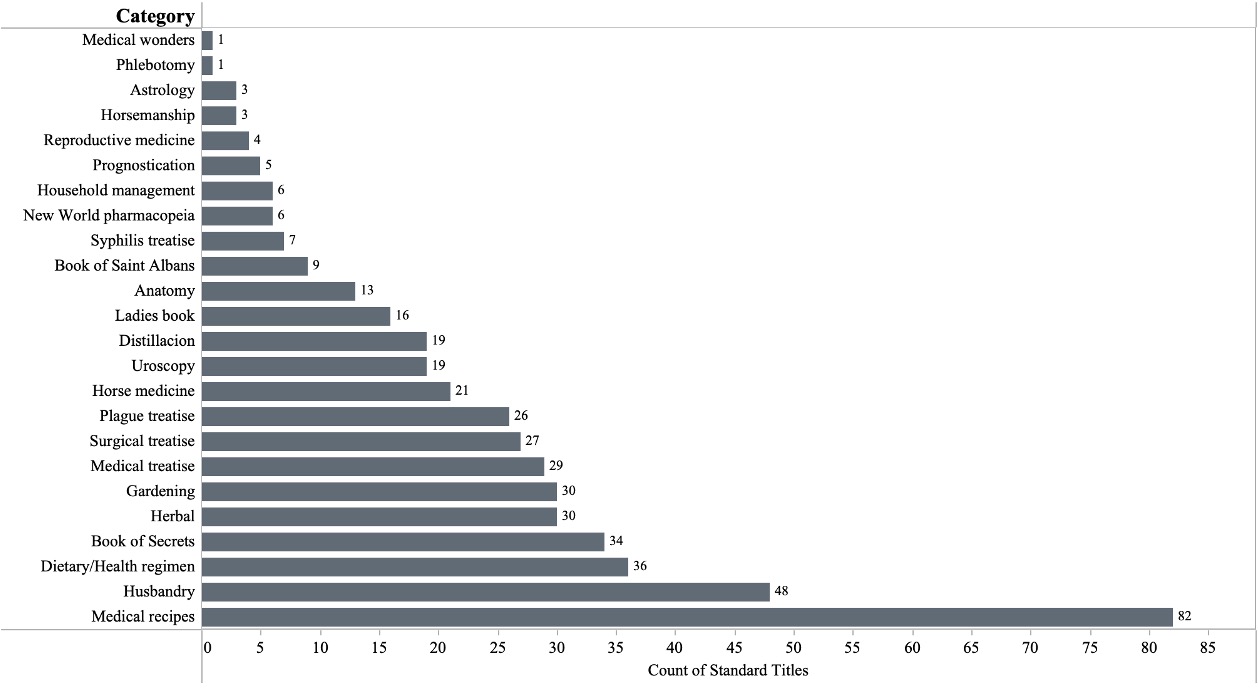
This bar graph illustrates how many practical books were published in each of these twenty-four
genres over the course of the sixteenth century.

Most Prolific Printers of Practical Books, by Publication Dates
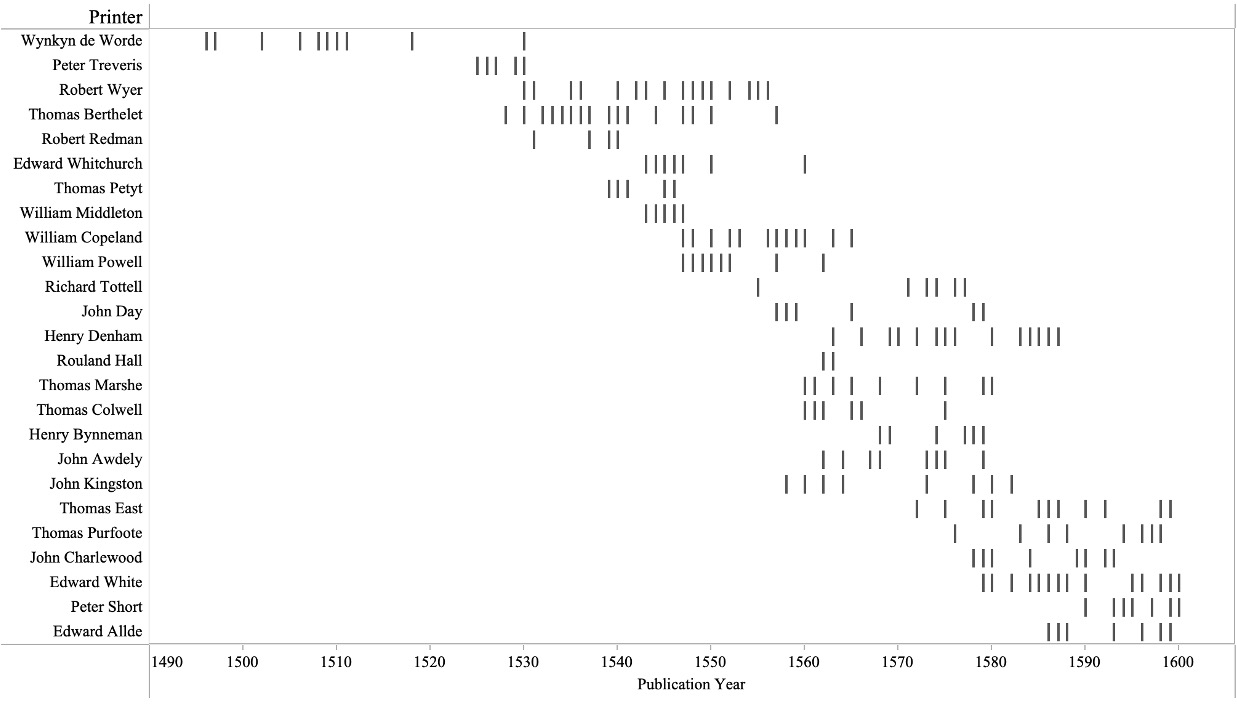
This Gantt chart shows the most prolific printers of practical books in sixteenth-century England.
Vertical marks indicate years in which these printers published an edition of a practical book, but
in some cases, these printers published more than one practical book in a single year. Thus, the chart doesn’t indicate
exactly how many practical books each printer produced in the course of a career, but it does
nicely illustrate how the careers of especially active printers (who were in direct competition with one another) overlapped.

Most Prolific Printers of Practical Books, by Number of Editions
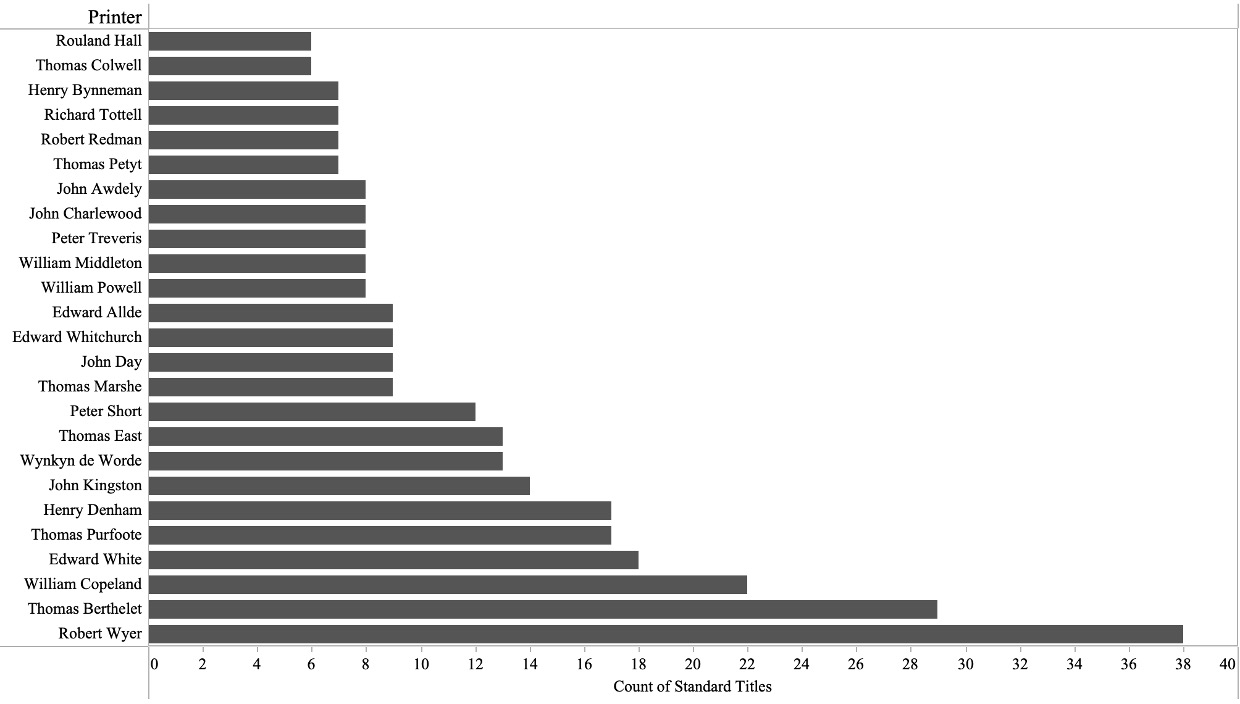
This bar graph shows the number of editions printed by the most prolific printers of practical
books in sixteenth-century England, defined as those who printed seven or more editions.

| Appendix A | Appendix B | Appendix C |
|---|---|---|
| Bibliographic Data | Network Analysis | Graphs & Gantt Plots |
